
Consider the following situation:
Imagine a company planning to launch a new version of its product. It must choose between two flavors: spicy or mild. To make an informed decision, the company randomly surveys 200 people about their preferences. The overall result is shown in the table below:
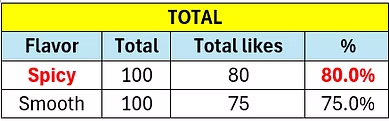
The result shows that 80% of users prefer the spicy flavor and 75% prefer the mild flavor, which leads us to believe that launching the spicy product would be the best decision.
However, when we analyze the same data broken down by the gender of the users (male or female), an unexpected pattern emerges:

The result now points to a preference for the mild flavor, for both male and female users. This is an interesting effect called Simpson's paradox.
Simpson's paradox is a phenomenon in probability and statistics where a trend appears in several groups of data but disappears or reverses when the groups are combined. It can have profound implications for companies, especially in KPIs, where leaders may make decisions based on aggregated data without considering possible variations in subgroups. Simpson's paradox can also impact predictive analysis.
Consider another example:
A company decides to analyze the relationship between advertising spending and the number of clicks (thousands). The aggregated graph (TOTAL) shows a positive relationship; however, when analyzed by group (perhaps by age), this relationship may not exist or may even be reversed (from an upward trend to a downward trend).
Although a general positive trend can be expected (i.e., more ads leading to more clicks), the downward trend can be attributed to ad fatigue. This occurs when excessive exposure to the same ads causes consumers to lose interest. They may engage less with the ads or even develop a negative perception of the brand. Additionally, if customers feel overwhelmed or bothered by too many ads, they may completely tune out, leading to a decline in sales.
These are two simple examples, but Simpson's paradox can appear in various contexts, including production, customer service, sales, and much more. By carefully segmenting the data — by product, customer demographics, region, or other factors — you can ensure more accurate and actionable insights.